Strategies

When it comes to individual players, there are a couple of numbers to look at to see if a player has been lucky, getting the bounces, whatever, and that is contributing to better-than-expected results.
On-ice shooting percentage refers to the 5-on-5 shooting percentage of all players when a particular player is on the ice. League average goaltending offers about a .922 save percentage in 5-on-5 situations so, naturally, average on-ice shooting percentages come in at 7.8%. Not every player shoots the puck with the same effectiveness, but even the best skaters can only have so much impact on a metric that involves four other skaters at any given time.
Very few players can, over the long haul, generate a substantially higher on-ice shooting percentage because it is so dependent on the performance of others. Sure, Sidney Crosby can hover over 11% and random fourth-liners hang around 5% year after year, but somewhere in between is where the vast majority of players fall. (Since 2007, among skaters to play at least 1000 minutes at 5-on-5, 592 of 796 skaters — 74.4% — fall between 6.5% and 9.0% on-ice shooting.)
The opposite angle of that percentage game is a player’s on-ice save percentage during 5-on-5 situations and this is another number that, over a larger sample, is beyond a skater’s control. A lot of it will depend on the goaltender, though a factor like quality of competition can play into those results too. If you’re facing top lines every night, for example, it’s not easy to hold their shooting percentages to five or six percent.
While the standard short-form measure for whether a player has been lucky is PDO (which combines on-ice shooting and save percentages), I thought I would break it into components because, while the tendency is to have a PDO around 1000 over the long haul, there are players that are outside that range.
Of 796 skaters to play at least 1000 5-on-5 minutes over the past seven seasons, 39 players have a cumulative PDO higher than 102.00, while 44 players have a PDO lower than 98.00. That leaves 713 of 796 (89.6%) within that 98-102 range.
What We’ve done is pulled out those players that have the largest differential from their previously-established on-ice shooting and save percentages to see who has benefited or being punished, essentially, by luck.
HIGH ON-ICE SHOOTING
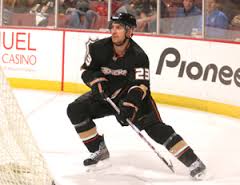
Francois Beauchemin, D, Anaheim
2007-2013 On-ice SH%: 6.86
2013-14 On-ice SH%: 11.30
Difference: +4.44
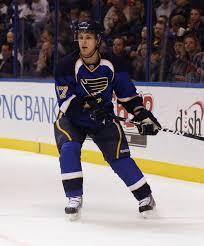
Vladimir Sobotka, C, St. Louis
2007-2013 On-ice SH%: 5.91
2013-14 On-ice SH%: 9.14
Difference: +3.23
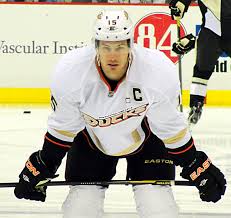
Ryan Getzlaf, C, Anaheim
2007-2013 On-ice SH%: 9.51
2013-14 On-ice SH%: 12.62
Difference: +3.11
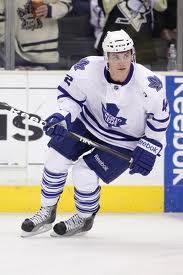
Tyler Bozak, C, Toronto
2007-2013 On-ice SH%: 8.43
2013-14 On-ice SH%: 11.40
Difference: +2.97
FantasyDraft MLB Contest